

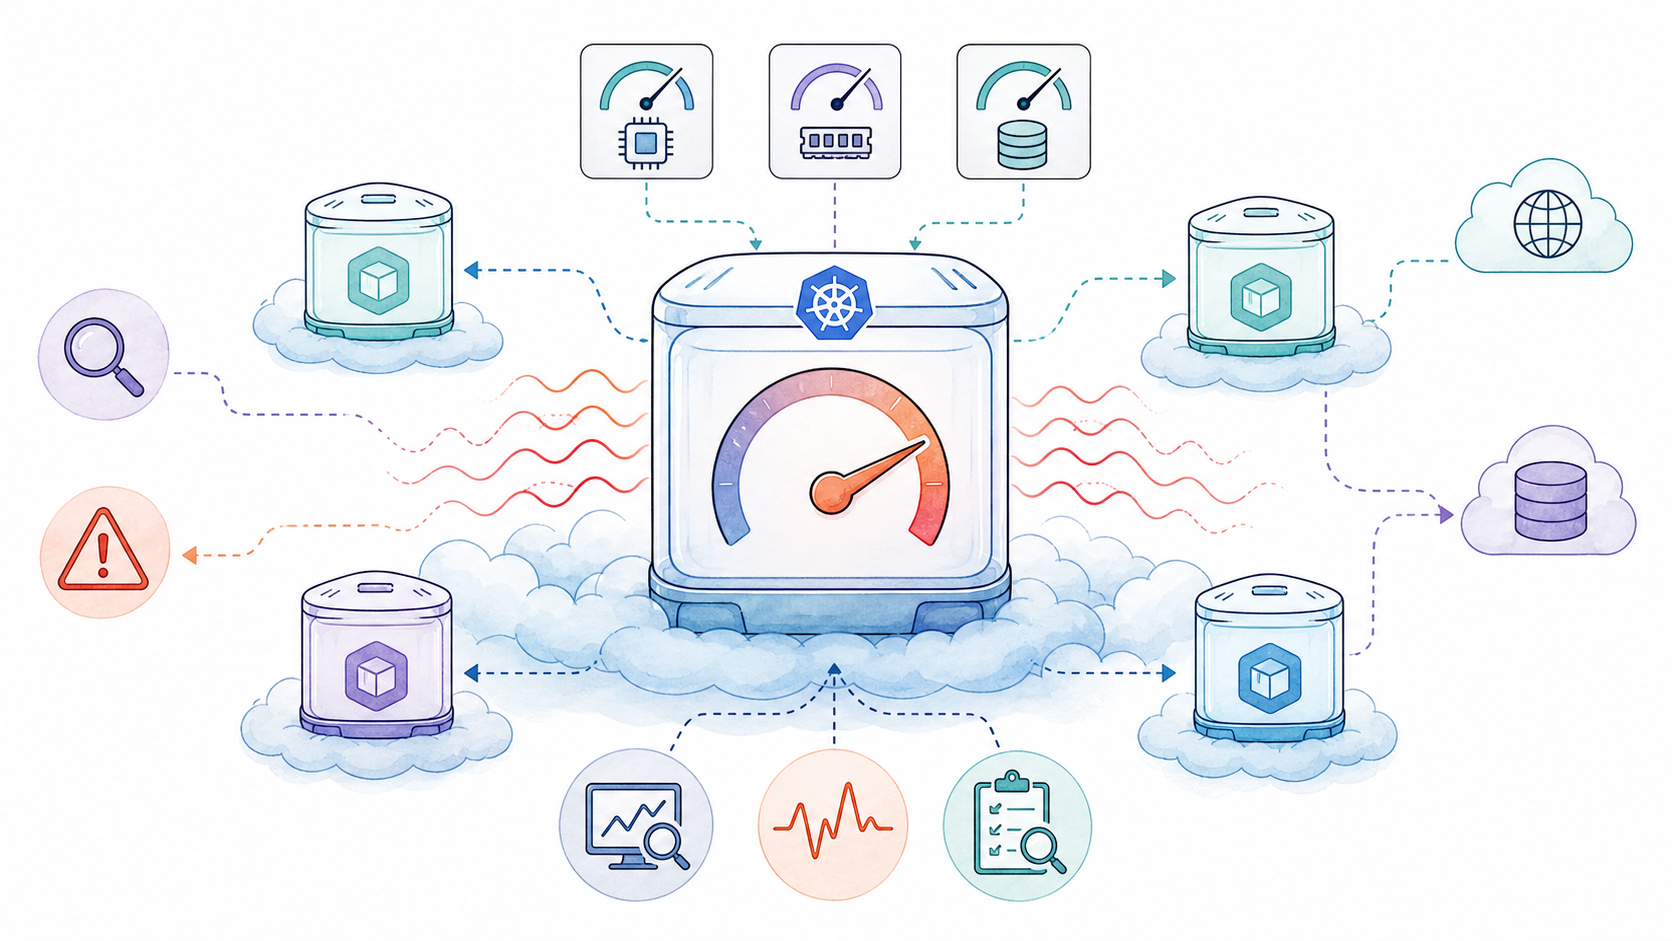
Kubernetes CPU throttling happens when a container wants more CPU time than its configured quota allows. The pod may still look “Running”, but latency rises, request queues grow, and dashboards show confusing CPU behavior. This guide explains how to prove throttling, when it matters, and how to fix it without blindly removing every CPU limit.
Quick takeaway: CPU throttling is not the same as high CPU usage. High usage means the workload is busy. Throttling means the kernel is deliberately delaying CPU time because a quota has been reached.
If the pod is not just slow but also restarting or failing before the application starts, split the incident path early: use the Kubernetes OOMKilled runbook for memory-limit exits and the Kubernetes ImagePullBackOff guide when the image cannot be pulled at all.
What Kubernetes CPU Throttling Means
Kubernetes uses CPU requests and limits for different jobs. A request helps the scheduler place the pod. A limit gives the kubelet and runtime a maximum amount of CPU the container can use. The official Kubernetes resource management documentation describes this split between scheduling and enforcement.
On Linux nodes, quota-based CPU enforcement is tied to CFS bandwidth control. That is why throttling metrics often include `cfs` in the name. If a container has a strict CPU limit and it uses its quota before the current period ends, it waits until the next period. The kernel behavior is documented in Linux CFS bandwidth control.
| Signal | What it means | Action |
|---|---|---|
| High CPU usage, low throttling | The workload is busy but not quota-blocked. | Scale, optimize, or add capacity if latency is high. |
| High throttling ratio | The container repeatedly hits its CPU quota. | Review CPU limit, request, workload bursts, and node pressure. |
| Low usage, high latency | CPU may not be the bottleneck. | Check I/O, network, locks, GC, downstream services, and readiness. |
Fast Checks Before You Open Prometheus
Start with simple Kubernetes checks. They will not prove every throttling case, but they quickly show whether the pod has CPU limits, whether usage is near the limit, and whether the issue is isolated to one deployment.
kubectl top pod -n payments
kubectl top pod -n payments --containers
kubectl describe pod -n payments checkout-api-7c8f9c6f9d-2kq5p | sed -n "/Limits:/,/Requests:/p"Code language: Bash (bash)
If you need a refresher on what the kubelet enforces on the node, see the RepoNotes Kubelet guide. If the issue only happens on a subset of nodes, also compare labels, taints, and placement rules with the Kubernetes node selector guide.
Prometheus Metrics That Prove CPU Throttling
The most useful throttling counters usually come from cAdvisor through the kubelet metrics pipeline. The cAdvisor Prometheus documentation lists `container_cpu_cfs_periods_total`, `container_cpu_cfs_throttled_periods_total`, and `container_cpu_cfs_throttled_seconds_total` as CPU metrics. Use Prometheus `rate()` over a range window to compare counter movement, as described in the Prometheus querying documentation.
sum by (namespace, pod, container) (
  rate(container_cpu_cfs_throttled_periods_total{container!=""}[5m])
)
/
sum by (namespace, pod, container) (
  rate(container_cpu_cfs_periods_total{container!=""}[5m])
)Code language: plaintext (plaintext)
A ratio near zero is usually fine. A sustained ratio above 10–20% during user-visible latency deserves attention. Treat this as a triage signal, not a universal SLO. Short startup bursts, batch jobs, and test environments can tolerate more throttling than latency-sensitive APIs.
sum by (namespace, pod, container) (
  rate(container_cpu_cfs_throttled_seconds_total{container!=""}[5m])
)Code language: plaintext (plaintext)
If the team already uses Prometheus and Grafana, this pairs naturally with the RepoNotes Prometheus and Grafana overview and the broader DevOps monitoring tools guide.
Common Causes
CPU throttling is usually caused by a mismatch between workload behavior and CPU limits. The limit may be too low, the workload may be bursty, or the pod may be packed onto nodes where it has little headroom.
| Cause | Typical symptom | Fix pattern |
|---|---|---|
| CPU limit set below normal burst demand | Latency spikes while average CPU looks reasonable. | Raise or remove the limit after measuring real usage. |
| Request is too low compared with limit | Pod gets scheduled onto crowded nodes and competes for CPU. | Set requests from p50/p90 real usage, then validate placement. |
| JVM, Go, Node.js, or Python worker burst | Short windows of throttling during GC, compilation, or request spikes. | Tune runtime concurrency and limit values together. |
| Batch job shares node with latency-sensitive service | Noisy neighbor pattern. | Separate workloads with node pools, priority, affinity, or limits. |
How to Fix Kubernetes CPU Throttling
Do not start by deleting every CPU limit. Start by proving whether throttling matches user impact, then change one variable at a time.
1. Compare usage, request, and limit
If the container spends most of its time close to the CPU limit and throttling rises during latency windows, the limit is likely too tight. If the limit is high but the request is tiny, scheduling may be the problem.
kubectl get deploy checkout-api -n payments -o jsonpath='{range .spec.template.spec.containers[*]}{.name}{"
requests: "}{.resources.requests}{"
limits: "}{.resources.limits}{"
"}{end}'Code language: Bash (bash)
2. Use a sane request and limit ratio
The official Kubernetes CPU task guide shows that a container cannot use more CPU than its configured limit. For latency-sensitive services, a very low limit can convert normal bursts into throttling. A common starting point is to set requests from observed normal usage and set limits only when you need hard containment.
resources:
  requests:
    cpu: "500m"
    memory: "512Mi"
  limits:
    cpu: "1500m"
    memory: "1Gi"Code language: YAML (yaml)
3. Separate bursty and latency-sensitive workloads
If batch workloads and APIs share the same nodes, CPU throttling can hide a placement problem. Use node pools, affinity, taints, priority classes, or separate namespaces with resource policies.
4. Tune the application, not only Kubernetes
Raising the limit is not always enough. Worker counts, thread pools, GC settings, connection pools, and request fan-out can all create burst patterns that hit CPU quotas. If throttling drops after a limit change but latency remains high, continue with application-level profiling.
PromQL Dashboard Starter
Use this starter panel set for a quick Grafana dashboard. It gives you the throttling ratio, throttled seconds, CPU usage, and CPU limit side by side.
# CPU usage by container
sum by (namespace, pod, container) (
  rate(container_cpu_usage_seconds_total{container!=""}[5m])
)

# CPU limit in cores
sum by (namespace, pod, container) (
  kube_pod_container_resource_limits{resource="cpu", unit="core"}
)

# Throttling ratio
sum by (namespace, pod, container) (
  rate(container_cpu_cfs_throttled_periods_total{container!=""}[5m])
)
/
sum by (namespace, pod, container) (
  rate(container_cpu_cfs_periods_total{container!=""}[5m])
)Code language: plaintext (plaintext)
Troubleshooting Checklist
Use this sequence when an alert says a Kubernetes service is slow and CPU throttling might be involved.
- Check whether latency and throttling rise during the same time window.
- Check container CPU requests and limits, not only pod-level averages.
- Compare throttling ratio across replicas. One bad replica can indicate node placement or local contention.
- Check whether the pod recently moved to a different node pool.
- Look for runtime-specific burst causes: GC, thread pools, worker concurrency, startup compilation, or expensive background jobs.
- If the pod is also failing health checks, use the Docker container unhealthy and Docker Compose healthcheck guides as adjacent troubleshooting patterns.
Should You Remove CPU Limits?
Sometimes, yes. For latency-sensitive services in trusted clusters, teams often keep memory limits but avoid strict CPU limits, relying on requests, autoscaling, and node capacity planning instead. But this is not a universal rule. Multi-tenant clusters, batch workloads, and noisy-neighbor risks may still need CPU limits.
A safer decision rule: remove or raise limits only after you can show sustained throttling during real user impact, and only if the workload has enough node headroom or autoscaling coverage.
Sources Used for This Guide
This article was checked against official and primary references: Kubernetes resource management, Kubernetes CPU requests and limits, cAdvisor Prometheus metrics, Prometheus query basics, and Linux CFS bandwidth control.
FAQ
What is Kubernetes CPU throttling?
Kubernetes CPU throttling happens when a container reaches its configured CPU quota and the Linux scheduler delays more CPU time until the next period. It is usually caused by CPU limits that are too tight for the workload burst pattern.
How do I know if a pod is CPU throttled?
Use Prometheus metrics such as container_cpu_cfs_throttled_periods_total divided by container_cpu_cfs_periods_total. Then compare the throttling ratio with latency, errors, and CPU usage during the same time window.
Is CPU throttling always bad?
No. Short throttling bursts can be normal for batch jobs, startup spikes, or non-critical workloads. It becomes a problem when sustained throttling lines up with latency, timeouts, queue growth, or user-visible errors.
Should I remove CPU limits in Kubernetes?
Not blindly. Removing CPU limits can help latency-sensitive services, but it can also allow noisy-neighbor behavior. First verify the throttling impact, check node headroom, and decide whether requests, autoscaling, and workload isolation are enough.
What is the difference between CPU requests and CPU limits?
A CPU request helps Kubernetes schedule the pod and reserve expected capacity. A CPU limit is an enforcement ceiling. A pod can be throttled when it tries to use more CPU than the limit allows.




Leave a Reply