Kubernetes OOMKilled: The Short Version
OOMKilled means a container process was killed because it ran out of memory under the limits enforced for that container or node. In Kubernetes, you usually see it in kubectl describe pod under the container state or last state, often with Reason: OOMKilled and Exit Code: 137.
The fix is not always “increase memory and move on.” Sometimes the pod limit is too low. Sometimes the request is too low and the pod lands on a busy node. Sometimes the application has a leak, a bad cache setting, an unsafe JVM heap value, or a batch job that needs a different execution pattern.
If the pod is slow but not being killed, compare the signal against the Kubernetes CPU throttling guide. If the container never starts because Kubernetes cannot pull the image, use the separate Kubernetes ImagePullBackOff runbook instead.
Use this guide as a production runbook: confirm the signal, separate pod-limit OOM from node pressure, inspect usage, choose the right fix, and prevent the same incident from coming back.
How OOMKilled Shows Up
Start with the pod status and container last state:
kubectl get pod <pod-name> -n <namespace>
kubectl describe pod <pod-name> -n <namespace>Code language: Bash (bash)
Look for fields like these in the container section:
State:          Waiting
Reason:         CrashLoopBackOff
Last State:     Terminated
Reason:         OOMKilled
Exit Code:      137Code language: plaintext (plaintext)
Exit Code: 137 means the process received SIGKILL. In many Kubernetes cases that is caused by out-of-memory enforcement, but do not treat every 137 as automatically proven OOM. The stronger signal is the combination of Reason: OOMKilled, recent memory pressure, and events or metrics that match the timing.
OOMKilled vs Evicted vs CrashLoopBackOff
These statuses often appear together, but they do not mean the same thing.
| Symptom | What it usually means | First check |
|---|---|---|
OOMKilled | A container exceeded memory available to it | kubectl describe pod, memory metrics, container limits |
Evicted | The node was under resource pressure and kubelet removed the pod | pod events, node conditions, kubectl describe node |
CrashLoopBackOff | The container keeps starting and exiting | previous logs, last state, exit code |
Exit Code 137 | Process received SIGKILL | confirm whether Kubernetes reports OOMKilled |
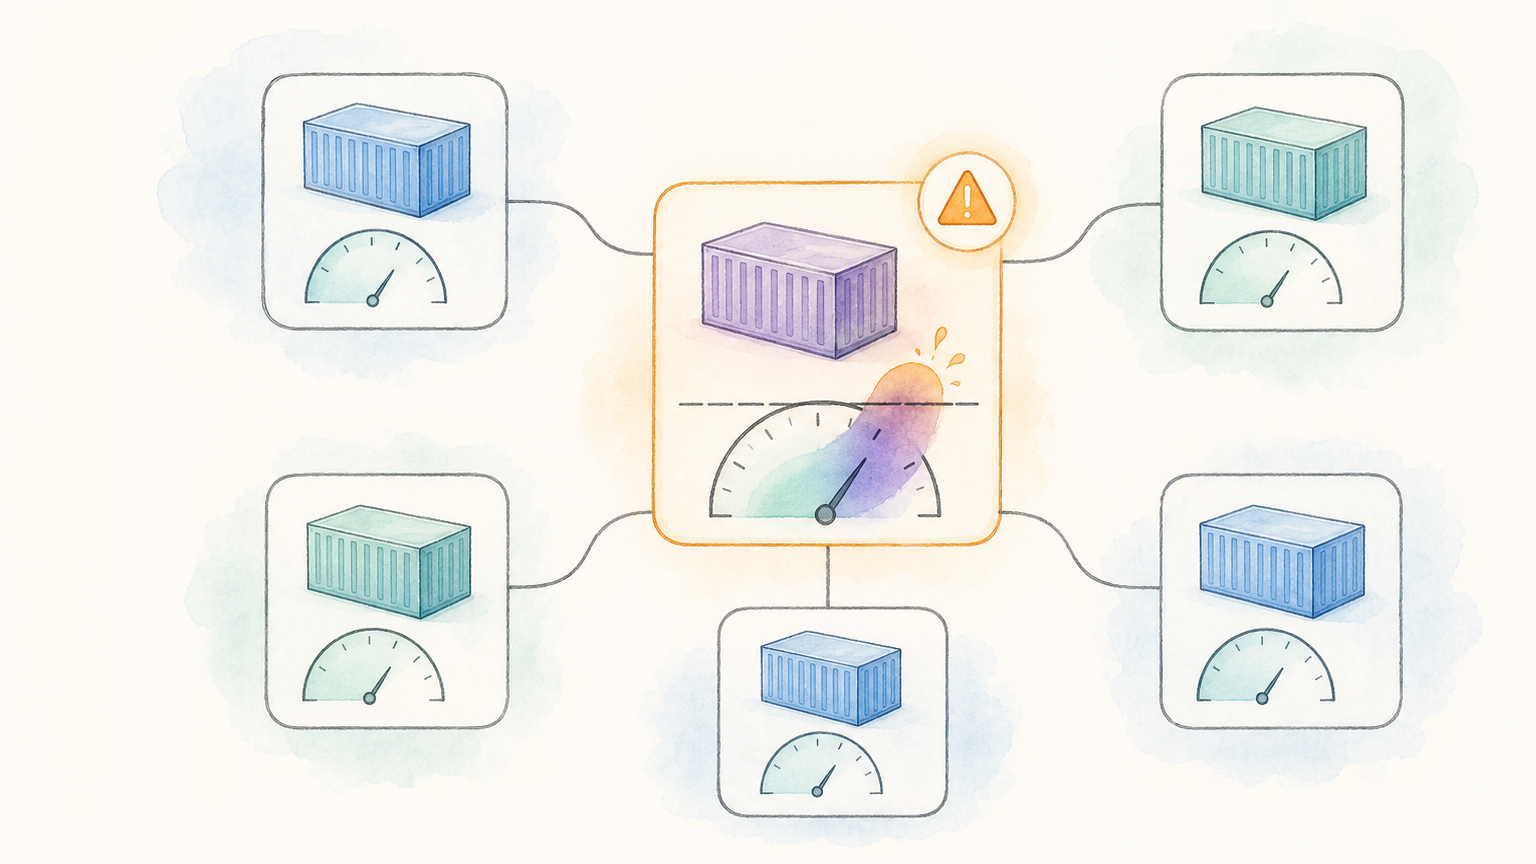
The important distinction: OOMKilled is usually a container-level memory failure. Evicted is usually a node-level resource pressure event. A pod can later enter CrashLoopBackOff because the application keeps restarting after the memory kill.
Step 1: Confirm the Container That Was Killed
Multi-container pods make OOM debugging confusing. Check each container, not only the pod summary.
kubectl describe pod <pod-name> -n <namespace>Code language: Bash (bash)If the pod has init containers, sidecars, or service mesh proxies, confirm which container has Last State: Terminated and Reason: OOMKilled.
For logs from the killed instance, use --previous:
kubectl logs <pod-name> -n <namespace> -c <container-name> --previousCode language: Bash (bash)This matters because the current container may already be a fresh restart. The useful error can be in the previous container logs, especially for JVM, Node.js, Python workers, or batch jobs.
Step 2: Check Requests, Limits, and QoS
Get the container resource settings:
kubectl get pod <pod-name> -n <namespace> -o jsonpath='{range .spec.containers[*]}{.name}{"\nrequests.memory="}{.resources.requests.memory}{"\nlimits.memory="}{.resources.limits.memory}{"\n\n"}{end}'Code language: Bash (bash)Kubernetes uses memory requests for scheduling and memory limits for enforcement. A pod with a low request can be scheduled onto a node that looks available on paper but is crowded in practice. A container with a tight memory limit can be killed even if the node still has free memory.
| Setting | Scheduling role | Runtime role |
|---|---|---|
requests.memory | Reserves capacity for placement decisions | Does not cap memory usage by itself |
limits.memory | Does not decide placement alone | Caps container memory and can trigger OOM kill |
| No memory limit | Avoids container limit OOM | Can still contribute to node pressure |
| Request equals limit | Predictable Guaranteed QoS when all containers do this for CPU and memory | Less overcommit, but less bin-packing flexibility |
If requests and limits are missing or unrealistic, fix that before tuning application code. If the settings look reasonable, move to runtime evidence.
Step 3: Compare Memory Usage to the Limit
If metrics are available, check current and recent memory usage:
kubectl top pod <pod-name> -n <namespace> --containers
kubectl top nodeCode language: Bash (bash)
For Prometheus setups, useful signals include container working set, restart count, and OOM kill counters. Query names vary by stack, but these patterns are common:
container_memory_working_set_bytes{namespace="<namespace>", pod="<pod-name>"}
kube_pod_container_status_restarts_total{namespace="<namespace>", pod="<pod-name>"}
kube_pod_container_status_last_terminated_reason{reason="OOMKilled"}Code language: plaintext (plaintext)
If memory ramps steadily until the kill, suspect a leak, unbounded cache, or workload growth. If memory spikes briefly, suspect request bursts, large payloads, batch windows, or startup behavior.
Step 4: Separate Pod Limit OOM From Node Pressure
Check pod events first:
kubectl get events -n <namespace> --sort-by=.lastTimestamp | tail -40Code language: Bash (bash)Then inspect the node:
kubectl describe node <node-name>Code language: Bash (bash)Look for MemoryPressure, eviction messages, or a cluster autoscaler event around the same time.
| Evidence | Likely path |
|---|---|
Reason: OOMKilled on one container, limit is near observed usage | tune container limit or app memory behavior |
Pod Evicted, node shows MemoryPressure | node capacity, requests, scheduling, or noisy neighbor problem |
| Many pods on the same node restart together | node pressure or infrastructure event |
| Only one container restarts repeatedly | app-level memory or container limit problem |
Do not fix a node pressure problem by only increasing one pod limit. That can move the next failure to a different workload.
Step 5: Pick the Right Fix
Choose the smallest fix that matches the evidence.
| Situation | Better fix | Why |
|---|---|---|
| Limit is clearly too low for normal workload | Increase limits.memory and usually requests.memory | The pod needs more room and better scheduling accuracy |
| Request is much lower than normal usage | Raise requests.memory | Scheduler needs a realistic reservation |
| JVM heap equals or exceeds container limit | Set heap below the limit | JVM plus native memory needs headroom |
| Memory grows until kill | Investigate leak or cache | Increasing the limit only delays the incident |
| Spike during startup | Add startup probe or reduce startup memory | Avoid false restarts and oversized initialization |
| Batch job processes too much at once | Chunk work or lower concurrency | Keeps peak memory predictable |
A practical starting point is to set the memory request near normal steady-state usage and set the limit above expected peak usage. The exact ratio depends on workload shape. A latency-sensitive service and a batch worker should not use the same memory policy.
Example: Safer Memory Settings
This example is not a universal recommendation. It shows the shape of a service with realistic request, higher limit, and probe timing that gives the app room to start.
apiVersion: apps/v1
kind: Deployment
metadata:
  name: api
spec:
  replicas: 3
  selector:
    matchLabels:
      app: api
  template:
    metadata:
      labels:
        app: api
    spec:
      containers:
        - name: api
          image: example/api:1.4.2
          resources:
            requests:
              memory: "512Mi"
              cpu: "250m"
            limits:
              memory: "1Gi"
              cpu: "1000m"
          startupProbe:
            httpGet:
              path: /healthz
              port: 8080
            failureThreshold: 30
            periodSeconds: 5
          livenessProbe:
            httpGet:
              path: /healthz
              port: 8080
            initialDelaySeconds: 20
            periodSeconds: 10Code language: YAML (yaml)
For JVM services, also check container-aware heap settings. Leave headroom for metaspace, thread stacks, direct buffers, TLS, native libraries, and sidecars. A common mistake is setting the heap too close to the Kubernetes memory limit.
Prevention Checklist
Use this before closing the incident:
| Check | Why it matters |
|---|---|
| Memory request reflects normal usage | avoids unrealistic scheduling |
| Memory limit has peak headroom | avoids repeat kills during normal spikes |
| Alerts include OOMKilled and restart reason | catches the real failure mode |
| Dashboard shows memory trend before restart | separates leak from one-off spike |
| Sidecars are included in resource planning | mesh/logging agents can consume meaningful memory |
| Load test or replay covers large payloads | catches peak memory paths before production |
| Runbook documents exact debug commands | reduces panic during the next incident |
Source Notes
The Kubernetes docs on resource management for pods and containers explain how requests and limits work. The official task guide for assigning memory resources includes an OOMKilled example. The Kubernetes pod lifecycle and debug running pods docs cover pod states, logs, and runtime debugging. Use these as the factual base, then adapt the runbook to your cluster metrics and workload type.
FAQ
Is Kubernetes OOMKilled the same as exit code 137?
Not exactly. Exit code 137 means the process received SIGKILL. OOMKilled is the Kubernetes reason that often explains that SIGKILL, but you should still confirm it in kubectl describe pod, events, and memory metrics.
Should I just increase the memory limit?
Only if the evidence shows the limit is lower than the workload’s expected peak. If memory keeps growing until the kill, a higher limit may only delay a leak. If the request is too low, also tune the request so scheduling matches reality.
Can a pod be OOMKilled if the node still has free memory?
Yes. A container can be killed for exceeding its own memory limit even when the node has remaining memory. Node-level memory pressure is a different path and often shows up as eviction or node MemoryPressure events.
What should I check first during an OOMKilled incident?
Start with kubectl describe pod, then check the killed container’s previous logs with kubectl logs --previous. After that, compare memory usage to requests and limits, then inspect node pressure and recent events.
How do I prevent OOMKilled in production?
Set realistic memory requests, leave enough limit headroom for peaks, monitor memory trend before restarts, and fix application-level leaks or oversized batch behavior. For JVM and similar runtimes, tune runtime memory settings so the process does not use the entire container limit.