

AWS CloudWatch vs Azure Monitor: Pricing, Features & When to Use Each
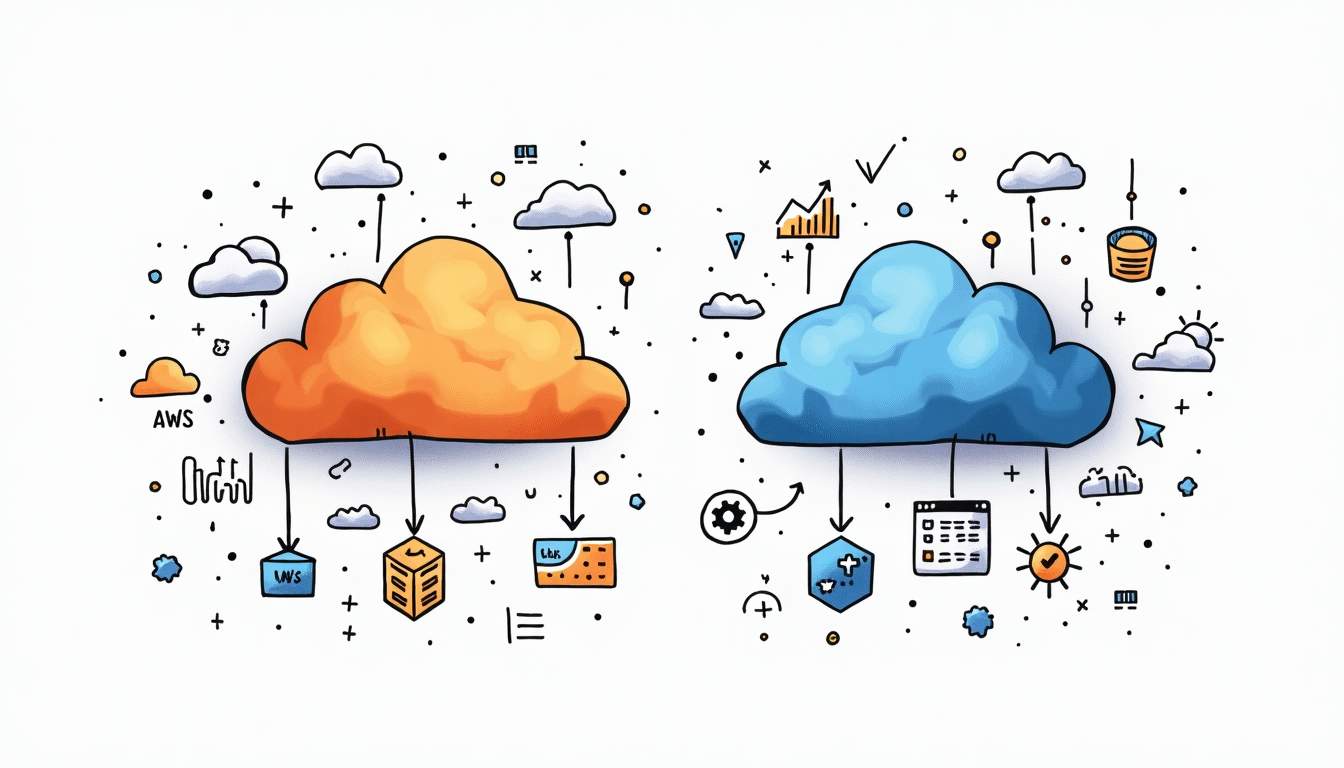
AWS CloudWatch collects metrics and logs from your AWS infrastructure. Azure Monitor does the same for Azure. If you’re running a single cloud, the choice is obvious – use the native tool.
The interesting question is what happens when you’re comparing the two for a multi-cloud setup, evaluating a cloud migration, or just trying to understand the trade-offs. This guide breaks down the real differences – pricing, alerting, log management, integrations, and where each tool falls short.
## CloudWatch and Azure Monitor at a Glance
Both are native monitoring platforms built into their respective clouds. They collect metrics, aggregate logs, trigger alerts, and provide dashboards. But they differ in architecture, pricing model, and how they handle third-party integrations.
| Feature | AWS CloudWatch | Azure Monitor |
|—|—|—|
| Metrics collection | Automatic for AWS services | Automatic for Azure services |
| Custom metrics | $0.30/metric/month | First 10 free, then $0.258/metric/month |
| Log ingestion | CloudWatch Logs – $0.50/GB | Log Analytics – $2.76/GB (pay-as-you-go) |
| Log retention (default) | Never expires (you pay storage) | 31 days free, then charged |
| Alerting | CloudWatch Alarms | Azure Monitor Alerts |
| APM | CloudWatch Application Signals + X-Ray | Application Insights |
| Dashboards | CloudWatch Dashboards ($3/dashboard/month) | Azure Workbooks (free) + Dashboards |
| IaC support | CloudFormation, Terraform, CDK | ARM/Bicep, Terraform |
| Third-party export | CloudWatch Metric Streams → Datadog/Splunk | Diagnostic Settings → Event Hubs |
## Metrics and Data Collection
Both platforms collect infrastructure metrics automatically, but they differ in how they handle custom metrics, resolution, and pricing tiers. Here’s how each one works.
### CloudWatch Metrics
CloudWatch collects metrics from over 100 AWS services automatically. EC2 instances report CPU, network, and disk metrics at 5-minute intervals (free) or 1-minute intervals (detailed monitoring – $3.50/instance/month).
Custom metrics cost $0.30/metric/month for the first 10,000, then decrease at scale. High-resolution metrics (1-second granularity) are available but expensive for large deployments.
CloudWatch also supports embedded metric format (EMF) – you write structured JSON to stdout from Lambda or ECS, and CloudWatch extracts metrics automatically:
“`json
{
“_aws”: {
“Timestamp”: 1234567890,
“CloudWatchMetrics”: [{
“Namespace”: “MyApp”,
“Dimensions”: [[“Service”]],
“Metrics”: [{“Name”: “ProcessingTime”, “Unit”: “Milliseconds”}]
}]
},
“Service”: “OrderAPI”,
“ProcessingTime”: 47
}
“`
### Azure Monitor Metrics
Azure Monitor collects platform metrics from Azure resources at 1-minute intervals by default – no extra cost. Custom metrics get 10 free metrics per resource, then $0.258/metric/month.
Azure Monitor also supports Prometheus-native metrics collection through Azure Monitor managed service for Prometheus. This is a big deal if your team already uses Prometheus – you keep your existing PromQL queries and Grafana dashboards while Azure handles storage and scaling:
“`yaml
# Azure Monitor Prometheus scrape config (via DCR)
apiVersion: azmonitoring.coreos.com/v1
kind: PodMonitor
metadata:
name: my-app-monitor
spec:
selector:
matchLabels:
app: my-api
podMetricsEndpoints:
– port: metrics
interval: 30s
“`
### Key Difference
CloudWatch is metric-type agnostic – everything goes into CloudWatch Metrics with the same API. Azure Monitor splits metrics into platform metrics, custom metrics, and Prometheus metrics, each with slightly different query interfaces and pricing. More flexibility, but more complexity to manage.
## Log Management
This is where the pricing difference hits hardest.
### CloudWatch Logs
CloudWatch Logs charges $0.50/GB for ingestion and $0.03/GB/month for storage. Logs never expire by default – good for compliance, bad for your bill if you forget to set retention policies.
Querying uses CloudWatch Logs Insights, a purpose-built query language:
“`
fields @timestamp, @message
| filter @message like /ERROR/
| stats count(*) as errorCount by bin(5m)
| sort errorCount desc
| limit 20
“`
Logs Insights scans data and charges $0.005/GB scanned. For large log volumes, this adds up fast.
### Azure Log Analytics
Azure Log Analytics (the log backend for Azure Monitor) charges $2.76/GB for pay-as-you-go ingestion – over 5x more than CloudWatch. However, commitment tiers bring this down significantly:
| Daily volume | Pay-as-you-go | Commitment tier | Effective $/GB |
|—|—|—|—|
| < 1 GB/day | $2.76/GB | N/A | $2.76 |
| 100 GB/day | $2.76/GB | $196/day | $1.96 |
| 500 GB/day | $2.76/GB | $738/day | $1.48 |
Log Analytics uses KQL (Kusto Query Language) – significantly more powerful than CloudWatch Logs Insights:
“`kusto
ContainerLog
| where LogEntry contains "ERROR"
| summarize ErrorCount = count() by bin(TimeGenerated, 5m), ContainerName
| order by ErrorCount desc
| take 20
“`
KQL supports joins, time-series analysis, machine learning functions, and cross-workspace queries. If your team does serious log analysis, KQL is a clear advantage.
### Azure Basic Logs
Azure introduced Basic Logs at $0.50/GB – the same price as CloudWatch. The catch: Basic Logs have limited KQL support (no joins, no aggregations across tables) and 8-day retention. Good for high-volume debug logs you rarely query.
### Verdict on Logs
CloudWatch wins on simple, predictable log pricing. Azure Monitor wins on query power and flexibility, but you'll pay more unless you commit to volume tiers or use Basic Logs strategically.
## Alerting and Incident Response
Setting up alerts is where most teams start with monitoring. Both platforms offer threshold-based alerts, but they take different approaches to routing, suppression, and anomaly detection.
### CloudWatch Alarms
CloudWatch Alarms are straightforward: set a threshold on a metric, choose an action (SNS notification, Auto Scaling, EC2 action). Pricing: $0.10/alarm/month for standard resolution, $0.30 for high-resolution.
Composite alarms let you combine multiple alarms with AND/OR logic – useful for reducing alert noise:
“`hcl
# Terraform – CloudWatch composite alarm
resource "aws_cloudwatch_composite_alarm" "service_health" {
alarm_name = "service-health-composite"
alarm_rule = "ALARM(${aws_cloudwatch_metric_alarm.high_cpu.alarm_name}) AND ALARM(${aws_cloudwatch_metric_alarm.high_latency.alarm_name})"
alarm_actions = [aws_sns_topic.ops_alerts.arn]
}
resource "aws_cloudwatch_metric_alarm" "high_cpu" {
alarm_name = "high-cpu"
comparison_operator = "GreaterThanThreshold"
evaluation_periods = 2
metric_name = "CPUUtilization"
namespace = "AWS/EC2"
period = 300
statistic = "Average"
threshold = 80
}
“`
CloudWatch also has anomaly detection that uses ML to build a baseline and alert on deviations – no manual threshold tuning.
### Azure Monitor Alerts
Azure Monitor Alerts support metric alerts, log alerts (KQL-based), and activity log alerts. Pricing depends on the type: metric alerts start at $0.10/rule/month, log search alerts at $0.50/rule/month.
Azure's alert processing rules let you suppress alerts during maintenance windows or route them conditionally – something CloudWatch handles less elegantly:
“`hcl
# Terraform – Azure Monitor metric alert
resource "azurerm_monitor_metric_alert" "high_cpu" {
name = "high-cpu-alert"
resource_group_name = azurerm_resource_group.main.name
scopes = [azurerm_linux_virtual_machine.main.id]
severity = 2
criteria {
metric_namespace = "Microsoft.Compute/virtualMachines"
metric_name = "Percentage CPU"
aggregation = "Average"
operator = "GreaterThan"
threshold = 80
}
action {
action_group_id = azurerm_monitor_action_group.ops.id
}
}
“`
Azure's action groups are more flexible than CloudWatch's SNS-based approach – a single action group can email, SMS, call a webhook, trigger a Logic App, and create an ITSM ticket simultaneously.
### Verdict on Alerting
Both handle basic threshold alerts well. Azure Monitor edges ahead on alert suppression, routing flexibility, and ITSM integration. CloudWatch has better anomaly detection out of the box.
## Application Performance Monitoring (APM)
Metrics and logs tell you what's broken. APM tells you why. The two platforms take fundamentally different architectural approaches here – AWS splits APM across two services, while Azure bundles everything into one.
### CloudWatch Application Signals + X-Ray
AWS split APM across two services. X-Ray handles distributed tracing, Application Signals handles SLOs and service maps. You need both for full APM coverage.
X-Ray pricing: free tier of 100,000 traces/month, then $5.00 per million traces recorded and $0.50 per million traces retrieved.
The integration between X-Ray and CloudWatch improved significantly in 2025 with Application Signals, but it still feels like two products stitched together compared to Azure's unified approach.
### Application Insights
Azure's Application Insights is a single, unified APM solution. It handles tracing, live metrics, smart detection (anomaly alerts), availability tests, and user analytics in one place.
Application Insights uses the same Log Analytics workspace and KQL for querying, so your APM data sits alongside your infrastructure logs. No context switching.
Pricing follows Log Analytics ingestion rates. The Application Insights SDK auto-instruments popular frameworks (.NET, Java, Node.js, Python) with minimal code changes.
### Verdict on APM
Application Insights is the more mature, unified product. AWS is catching up with Application Signals, but the split between X-Ray and CloudWatch adds operational overhead.
## Pricing Deep Dive
Here's what monitoring actually costs for a mid-size deployment (50 EC2/VM instances, 10 microservices, 50 GB logs/day):
| Cost component | AWS CloudWatch | Azure Monitor |
|—|—|—|
| Infrastructure metrics | Free (basic) / $175/mo (detailed) | Free |
| Custom metrics (100) | $30/mo | $23/mo |
| Log ingestion (50 GB/day) | $750/mo | $1,380/mo (PAYG) or $738/mo (commitment) |
| Log storage (90-day retention) | $405/mo | Included in commitment tier |
| Dashboards (5) | $15/mo | Free (Workbooks) |
| Alarms/alerts (50) | $5–15/mo | $5–25/mo |
| APM (10 services) | ~$150/mo (X-Ray) | Included in log ingestion |
| **Estimated total** | **~$1,400–1,500/mo** | **~$800–1,200/mo** |
*Estimates based on published pricing as of early 2026. Actual costs vary by region and usage patterns.*
The surprise: Azure Monitor can be cheaper at scale despite higher per-GB log pricing, because commitment tiers, free dashboards, and included APM offset the difference. CloudWatch's costs are more predictable but add up across multiple billing dimensions.
### Cost Optimization Tips
**CloudWatch:**
– Set log retention policies aggressively – default "never expire" is a cost trap
– Use CloudWatch Logs Insights sparingly; large scans are expensive
– Consider CloudWatch Metric Streams to push data to a cheaper backend (S3 + Athena) for long-term analysis
**Azure Monitor:**
– Commit to a daily volume tier as soon as your log volume stabilizes
– Use Basic Logs ($0.50/GB) for high-volume, low-query tables
– Archive logs to Storage Account for long-term compliance (pennies per GB)
## Integration Ecosystem
Few teams rely on a single monitoring tool. Most push data from native platforms to Datadog, Grafana, Splunk, or a SIEM. How easily each platform exports data matters.
### CloudWatch → Third-Party Tools
CloudWatch Metric Streams push real-time metrics to Datadog, New Relic, Splunk, and Dynatrace via Amazon Kinesis Data Firehose. This is AWS's answer to teams that want CloudWatch as a collector but prefer third-party visualization.
CloudWatch Logs subscriptions can stream logs to Lambda, Kinesis, or OpenSearch. The most common pattern: CloudWatch → Kinesis Firehose → S3 → your SIEM.
### Azure Monitor → Third-Party Tools
Azure Diagnostic Settings route metrics and logs to Event Hubs, Storage Accounts, or partner solutions (Datadog, Elastic, Logz.io). Azure Monitor also supports OpenTelemetry natively through the Azure Monitor OpenTelemetry Distro.
Azure's integration with Grafana deserves a special mention – Azure Managed Grafana connects directly to Azure Monitor and Prometheus data sources. If your team lives in Grafana, this makes Azure Monitor significantly more accessible.
### Verdict on Integrations
Both work well with major observability platforms. Azure Monitor has a slight edge on Prometheus and Grafana integration. CloudWatch has better Lambda-based processing pipelines. For a broader look at monitoring in the context of reliability engineering, check out our list of top SRE tools.
## Multi-Cloud Monitoring
Neither CloudWatch nor Azure Monitor is designed as a multi-cloud monitoring solution. If you run workloads across AWS and Azure, you have three realistic options:
**Option 1: Native tools + centralized SIEM.** Use CloudWatch for AWS, Azure Monitor for Azure, and aggregate critical alerts/logs in a third-party tool (Datadog, Splunk, Elastic). Most teams end up here.
**Option 2: OpenTelemetry everywhere.** Instrument your applications with OpenTelemetry, send telemetry to both native tools and a central backend. Azure Monitor supports OTLP natively; CloudWatch requires the AWS Distro for OpenTelemetry (ADOT).
**Option 3: Third-party platform as primary.** Use Datadog or New Relic as the primary monitoring layer, with native tools as secondary. Higher cost but unified view.
## Migration: CloudWatch → Azure Monitor (and Back)
Moving between monitoring platforms isn’t a lift-and-shift. Here’s what actually transfers:
| Component | Transferable? | Notes |
|—|—|—|
| Dashboards | Rebuild required | No export/import between platforms |
| Alert rules | Rebuild required | Different threshold syntax and capabilities |
| Log queries | Partial rewrite | CloudWatch Insights → KQL requires syntax changes |
| Custom metrics | Rebuild required | Different APIs, different namespaces |
| Retention policies | Reconfigure | Different defaults and pricing models |
| IAM/RBAC | Rebuild required | Completely different permission models |
The realistic migration timeline for a mid-size team: 2–4 weeks for core monitoring, 1–2 months for full parity including custom dashboards and runbooks.
### CloudWatch Insights → KQL Cheat Sheet
| CloudWatch Logs Insights | KQL (Azure Log Analytics) |
|—|—|
| `fields @timestamp, @message` | `| project TimeGenerated, Message` |
| `filter @message like /ERROR/` | `| where Message contains “ERROR”` |
| `stats count(*) by bin(5m)` | `| summarize count() by bin(TimeGenerated, 5m)` |
| `sort @timestamp desc` | `| order by TimeGenerated desc` |
| `limit 20` | `| take 20` |
## When to Skip Both and Use a Third-Party Tool
CloudWatch and Azure Monitor are great as native, first-party solutions. But they have real limitations that push many teams toward Datadog, New Relic, Grafana Cloud, or Splunk:
**You need a single pane of glass across clouds.** If you run workloads on AWS and Azure (or GCP, or on-prem), neither native tool gives you a unified view. Third-party platforms aggregate data from all sources into one dashboard, one alert system, one query language.
**Your team already knows Prometheus + Grafana.** Azure Monitor’s Prometheus integration is good, but CloudWatch’s is bolted-on (Amazon Managed Prometheus is a separate service). If your team’s workflow is built around PromQL and Grafana dashboards, Grafana Cloud or a self-hosted Grafana stack might cause less friction. For a deeper look at how these two tools compare, see our Prometheus vs Grafana breakdown.
**You need advanced distributed tracing.** AWS X-Ray and Azure Application Insights handle basic tracing, but tools like Jaeger, Tempo, or Datadog APM offer more sophisticated trace analysis, service maps, and correlation capabilities – especially for complex microservices architectures.
**You want vendor-neutral instrumentation.** OpenTelemetry is becoming the standard for observability instrumentation. Both CloudWatch and Azure Monitor support OTLP, but third-party platforms often have deeper OTLP support and community-maintained integrations.
The trade-off is always cost vs. convenience. Native tools are cheaper for basic monitoring within a single cloud. Third-party tools cost more but save engineering time in complex environments. Most teams with 50+ services across multiple environments end up with a hybrid approach: native tools for infrastructure metrics, third-party tool for application observability.
## Decision Matrix
Use this to pick the right tool based on your actual situation:
| Your situation | Recommended tool | Why |
|—|—|—|
| 100% AWS infrastructure | CloudWatch | Native integration, lower operational overhead |
| 100% Azure infrastructure | Azure Monitor | Native integration, unified with Azure portal |
| Microsoft 365 + Azure hybrid | Azure Monitor | Deep integration with Microsoft ecosystem |
| Kubernetes-heavy (AKS/EKS) | Azure Monitor | Better Prometheus + Grafana integration |
| Serverless-heavy (Lambda) | CloudWatch | Native Lambda metrics, X-Ray tracing, EMF |
| Cost-sensitive, high log volume | Azure Monitor | Commitment tiers + Basic Logs reduce cost at scale |
| Cost-sensitive, low log volume | CloudWatch | Simpler pricing, lower base costs |
| Multi-cloud (AWS + Azure) | Third-party tool | Neither platform handles multi-cloud well natively |
| Heavy log querying/analytics | Azure Monitor | KQL is significantly more powerful |
## Getting Started: Terraform Setup
Here’s the minimal Terraform configuration to set up basic monitoring for each platform. If you’re new to HCL syntax, our guide on Terraform variables covers the fundamentals you’ll need.
### CloudWatch – Monitor an EC2 Instance
“`hcl
# Enable detailed monitoring + basic dashboard + SNS alerts
provider “aws” {
region = “us-east-1”
}
resource “aws_instance” “web” {
ami = “ami-0c55b159cbfafe1f0”
instance_type = “t3.medium”
monitoring = true # Enables detailed monitoring (1-min intervals)
}
resource “aws_sns_topic” “alerts” {
name = “monitoring-alerts”
}
resource “aws_sns_topic_subscription” “email” {
topic_arn = aws_sns_topic.alerts.arn
protocol = “email”
endpoint = “[email protected]”
}
resource “aws_cloudwatch_metric_alarm” “cpu” {
alarm_name = “high-cpu-web”
comparison_operator = “GreaterThanThreshold”
evaluation_periods = 2
metric_name = “CPUUtilization”
namespace = “AWS/EC2”
period = 300
statistic = “Average”
threshold = 80
alarm_actions = [aws_sns_topic.alerts.arn]
dimensions = {
InstanceId = aws_instance.web.id
}
}
resource “aws_cloudwatch_log_group” “app_logs” {
name = “/app/web-server”
retention_in_days = 30 # Don’t forget this – default is forever
}
resource “aws_cloudwatch_dashboard” “main” {
dashboard_name = “web-server-overview”
dashboard_body = jsonencode({
widgets = [
{
type = “metric”
x = 0
y = 0
width = 12
height = 6
properties = {
metrics = [
[“AWS/EC2”, “CPUUtilization”, “InstanceId”, aws_instance.web.id]
]
period = 300
title = “CPU Utilization”
}
}
]
})
}
“`
Total setup time: ~15 minutes. Cost: ~$7/month (detailed monitoring + 1 dashboard + 1 alarm).
### Azure Monitor – Monitor a Virtual Machine
“`hcl
provider “azurerm” {
features {}
}
resource “azurerm_resource_group” “main” {
name = “monitoring-rg”
location = “East US”
}
resource “azurerm_log_analytics_workspace” “main” {
name = “app-log-analytics”
location = azurerm_resource_group.main.location
resource_group_name = azurerm_resource_group.main.name
sku = “PerGB2018”
retention_in_days = 30
}
resource “azurerm_monitor_action_group” “ops” {
name = “ops-alerts”
resource_group_name = azurerm_resource_group.main.name
short_name = “ops”
email_receiver {
name = “ops-team”
email_address = “[email protected]”
}
}
resource “azurerm_monitor_metric_alert” “cpu” {
name = “high-cpu-alert”
resource_group_name = azurerm_resource_group.main.name
scopes = [azurerm_linux_virtual_machine.web.id]
severity = 2
frequency = “PT5M”
window_size = “PT15M”
criteria {
metric_namespace = “Microsoft.Compute/virtualMachines”
metric_name = “Percentage CPU”
aggregation = “Average”
operator = “GreaterThan”
threshold = 80
}
action {
action_group_id = azurerm_monitor_action_group.ops.id
}
}
“`
Total setup time: ~20 minutes. Cost: starts free for platform metrics, ~$3–5/month for basic log ingestion.
## Common Issues and Troubleshooting
These are the problems teams hit most often when setting up monitoring on each platform – and how to fix them.
### CloudWatch
**Problem: Logs not appearing in CloudWatch.**
Most common cause: the EC2 instance or Lambda function doesn’t have the right IAM permissions. Your role needs `logs:CreateLogGroup`, `logs:CreateLogStream`, and `logs:PutLogEvents`. For EC2, make sure the CloudWatch agent is installed and running:
“`bash
# Check CloudWatch agent status
sudo /opt/aws/amazon-cloudwatch-agent/bin/amazon-cloudwatch-agent-ctl -a status
“`
**Problem: Unexpected CloudWatch bill spike.**
Check two things: log ingestion volume (CloudWatch → Logs → check “Incoming bytes” metric) and Logs Insights query volume. A single team member running expensive queries across months of logs can generate hundreds of dollars in scan charges.
**Problem: Alarm is in INSUFFICIENT_DATA state.**
The metric either doesn’t exist yet (no data points) or the dimensions don’t match. Double-check the namespace, metric name, and dimension values. The most common mistake: using the wrong InstanceId or forgetting to enable detailed monitoring.
### Azure Monitor
**Problem: Logs not appearing in Log Analytics.**
Check Diagnostic Settings on the resource – each Azure resource needs explicit configuration to send logs to Log Analytics. Unlike CloudWatch (which is often automatic), Azure Monitor requires you to opt-in per resource.
**Problem: KQL query is slow.**
Large time ranges + complex joins cause slow queries. Use `| where TimeGenerated > ago(1h)` to narrow the scan window first. Also check if you’re querying Basic Logs tables – they have restricted KQL support and can be slow for aggregations.
**Problem: Alert fires too often (noisy alerts).**
Use dynamic thresholds instead of static ones – they adapt to your metric patterns (daily, weekly cycles). Also consider alert processing rules to suppress alerts during maintenance windows or aggregate multiple alerts into a single notification.
## Recent Updates (2025–2026)
Both platforms shipped significant features over the past year. Here’s what changed and why it matters for your monitoring setup.
### CloudWatch Updates
– **CloudWatch Application Signals** (GA 2024) – SLO monitoring and service maps, bridging the gap between CloudWatch and X-Ray
– **Cross-account observability** – centralize monitoring across multiple AWS accounts without complex log forwarding
– **CloudWatch Logs Live Tail** – real-time log streaming in the console, similar to `tail -f`
– **Improved Contributor Insights** – identify top-N contributors to a metric in real time
### Azure Monitor Updates
– **Azure Monitor managed service for Prometheus** (GA) – native Prometheus metrics collection and storage
– **Azure Managed Grafana** integration – first-party Grafana with Azure AD authentication
– **Log Analytics Basic Logs** – low-cost tier for high-volume, infrequent-query logs
– **OpenTelemetry Distro for Azure** – simplified OTLP instrumentation for Azure-hosted apps
– **Workspace transformation rules** – transform or filter log data at ingestion time to reduce costs
## FAQ
Common questions about choosing between CloudWatch and Azure Monitor – based on what people actually ask.
### Is CloudWatch or Azure Monitor better for Kubernetes?
Azure Monitor has a clear advantage for Kubernetes monitoring. Azure Monitor managed service for Prometheus collects Kubernetes metrics natively, integrates with Azure Managed Grafana, and supports PromQL queries. CloudWatch Container Insights works but requires the CloudWatch agent or ADOT collector, and lacks native Prometheus support.
### Can I use CloudWatch with Azure, or vice versa?
Technically yes, but it’s impractical. You’d need custom pipelines to push metrics cross-cloud, and you’d lose native integration benefits. For multi-cloud monitoring, use OpenTelemetry to instrument apps and send data to a third-party platform.
### Which is cheaper: CloudWatch or Azure Monitor?
It depends on your log volume. Below ~10 GB/day, CloudWatch is cheaper. Above ~100 GB/day, Azure Monitor’s commitment tiers and Basic Logs make it competitive or cheaper. Always model your specific usage before committing.
### Does CloudWatch support Prometheus?
CloudWatch has Amazon Managed Service for Prometheus (AMP), but it’s a separate service with separate pricing – not integrated into CloudWatch natively. Azure Monitor integrates Prometheus metrics directly into the Azure Monitor platform.
### How do CloudWatch and Azure Monitor handle anomaly detection?
CloudWatch uses ML-based anomaly detection on any metric – it builds a baseline over 2 weeks and creates a band of expected values. Azure Monitor relies on smart detection in Application Insights (for APM data) and dynamic thresholds for metric alerts. Both work, but CloudWatch’s approach is more general-purpose.

Search
Latest Posts
Latest Comments
No comments to show.
Categories
Archives
- August 2026 (3)
- July 2026 (3)
- June 2026 (37)
- May 2026 (32)
- April 2026 (13)
- March 2026 (23)
- February 2026 (27)
- January 2026 (45)
- November 2025 (11)
Leave a Reply