

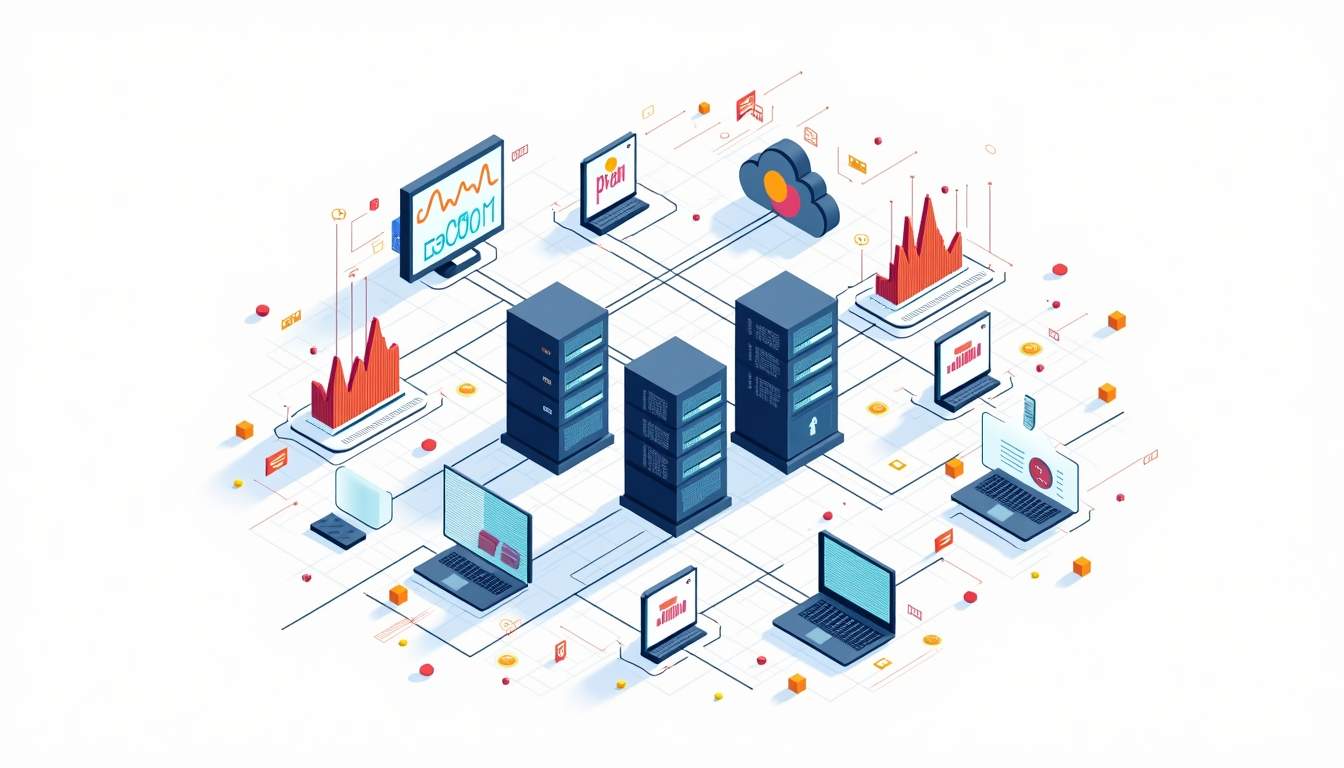
DevOps monitoring tools are useful only when they help teams detect user-facing problems, understand the cause, and act before an incident expands. A long tool list is less valuable than a stack that covers the right signals and has clear ownership.
Quick takeaway: start with the four monitoring signals: metrics, logs, traces, and synthetic checks. Then pick tools that fit your platform, alerting model, and team maturity instead of buying every observability feature at once.
This guide narrows the usual “best tools” list into a practical selection framework for DevOps and SRE teams. It also connects the choices to existing Prometheus, Grafana, and cloud monitoring patterns so the article does not duplicate a single-tool tutorial.
What a DevOps Monitoring Stack Must Cover
A monitoring stack should answer four questions quickly: is something broken, who is affected, what changed, and where should the team look first? That usually requires more than one category of tool.
| Layer | What It Tracks | Common Tools | Selection Question |
|---|---|---|---|
| Metrics | Time-series health and performance signals such as latency, error rate, saturation, and throughput. | Prometheus, Grafana, CloudWatch, Datadog, Elastic | Can the team see service health before users report it? |
| Logs | Events and application messages that explain what happened. | Elastic, Datadog, CloudWatch Logs, Loki | Can engineers search and correlate logs during an incident? |
| Traces | Request paths across services and dependencies. | OpenTelemetry, Jaeger, Datadog APM, Elastic APM | Can the team isolate slow hops in distributed systems? |
| Synthetic checks | External probes that test user-visible flows. | Prometheus Blackbox Exporter, Datadog Synthetics, cloud uptime checks | Can the team detect a broken login, API, or endpoint from outside the cluster? |
| Alerting and on-call | Routing, escalation, deduplication, and incident context. | Grafana Alerting, Alertmanager, PagerDuty, Opsgenie | Can alerts reach the right owner with enough context? |
Core Open-Source Monitoring Tools
Open-source tools are a strong default when the team wants control, portability, and lower licensing pressure. They do require operational ownership: storage, retention, alert quality, upgrades, and integrations are still your responsibility.
Prometheus
Prometheus is a metrics and alerting system built around a pull model and time-series data. It is a common baseline for Kubernetes and service monitoring. If you need the focused version, see the existing Prometheus and Grafana overview.
Grafana
Grafana is the visualization and dashboard layer many teams put on top of Prometheus, Loki, CloudWatch, and other data sources. The key decision is not “Grafana or Prometheus” but which data source owns each signal. For that comparison, use the Prometheus vs Grafana guide.
OpenTelemetry
OpenTelemetry gives teams a vendor-neutral way to collect traces, metrics, and logs. It is most valuable when you run distributed services and want to avoid locking instrumentation to one commercial platform.
Prometheus Blackbox Exporter
Blackbox checks test endpoints from the outside. They are useful for HTTP, TCP, DNS, and ICMP probes, especially when internal metrics look fine but users still cannot reach a service. RepoNotes already has a dedicated Prometheus Blackbox Exporter guide for that narrower pattern.
Commercial and Cloud-Native Options
Commercial platforms make sense when the team values faster setup, managed retention, cross-signal correlation, and support more than operating the full stack itself. Cloud-native tools are often the easiest starting point when most workloads live in one cloud.
| Option | Best Fit | Watch Out For |
|---|---|---|
| Datadog | Teams that want metrics, logs, APM, dashboards, synthetics, and alert routing in one managed platform. | Costs can grow quickly if tags, custom metrics, and log ingestion are not governed. |
| Elastic Observability | Teams already using Elasticsearch or needing strong log/search workflows with APM and infrastructure monitoring. | Index lifecycle and storage design matter; unmanaged retention gets expensive. |
| Amazon CloudWatch | AWS-heavy teams that need native metrics, logs, alarms, and service integration. | Cross-cloud or Kubernetes-heavy setups may need extra exporters and dashboards. |
| Grafana Cloud | Teams that like Grafana/Prometheus/Loki patterns but want managed hosting. | Still requires signal design, alert hygiene, and ownership rules. |
If your platform work also touches deployment automation, keep monitoring changes tied to release quality. The same “verify before rollout” mindset from Azure CI/CD pipeline optimization applies here: dashboard coverage and alerts should move with the service, not appear weeks later.
How to Choose the Right Monitoring Tools
Tool selection should follow the system shape. A small monolith, Kubernetes platform, data pipeline, and multi-cloud service do not need the same observability stack on day one.
- Map the critical user journeys first. Monitor login, checkout, API availability, background jobs, or data freshness before vanity infrastructure metrics.
- Pick one primary metrics path. For many teams that means Prometheus plus Grafana, CloudWatch for AWS-native systems, or a managed platform such as Datadog.
- Decide where logs live and how long they are retained. Incident logs and compliance logs may have different retention needs.
- Use OpenTelemetry when distributed tracing matters or when you want portable instrumentation.
- Define ownership for every alert. If no team owns the response, the alert should not page anyone.
- Review cost drivers early: high-cardinality metrics, verbose logs, trace sampling, and long retention windows.
Best Practices for DevOps Monitoring
Good monitoring is mostly operational discipline. The tools help, but they cannot fix noisy alerts, missing runbooks, or dashboards that nobody opens during an incident.
| Practice | Why It Matters | Practical Check |
|---|---|---|
| Monitor user impact first | CPU and memory do not always match customer pain. | Track availability, latency, error rate, and key business transactions. |
| Use service-level objectives | SLOs separate real reliability work from dashboard watching. | Define targets for the few services that matter most. |
| Reduce alert noise | Noisy alerts train teams to ignore pages. | Review pages weekly and remove alerts with no action path. |
| Attach runbooks | An alert without a next step slows incident response. | Every paging alert should link to a dashboard, owner, and first checks. |
| Instrument during delivery | Monitoring added after launch is usually incomplete. | Include metrics, logs, and tracing in the release checklist. |
| Test synthetic checks | External probes catch DNS, TLS, routing, and auth failures. | Run checks from outside the cluster or cloud account. |
A Simple Rollout Plan
If the current setup is messy, do not replace everything at once. Use a phased rollout so each layer earns trust before the next one is added.
- Week 1: define critical services, owners, and the first five user-impact signals.
- Week 2: standardize metrics dashboards and remove alerts that nobody acts on.
- Week 3: connect logs to incident workflows and document the top failure patterns.
- Week 4: add traces or synthetics where metrics and logs still leave blind spots.
- Month 2: review cost, cardinality, retention, and on-call feedback before expanding coverage.
Common Mistakes
Most monitoring failures come from unclear scope, not from picking the wrong logo on a vendor shortlist.
- Buying a full observability platform before defining ownership and alert policy.
- Tracking infrastructure metrics but missing the user journey that actually fails.
- Creating dashboards for leadership but not for incident response.
- Using high-cardinality labels without cost controls.
- Treating logs as unlimited storage instead of a diagnostic signal with retention rules.
- Adding tracing everywhere before the team can use basic metrics and logs well.
FAQ
Use these answers to narrow the stack before you commit to a vendor or rebuild an existing setup.
What are the most important DevOps monitoring tools?
The most common baseline is Prometheus for metrics, Grafana for dashboards, a log platform such as Elastic or CloudWatch Logs, and tracing or APM through OpenTelemetry, Datadog, or Elastic APM when distributed systems need it.
Is Prometheus enough for DevOps monitoring?
Prometheus is strong for metrics and alerting, but it does not replace logs, traces, synthetic checks, or incident routing. Many teams pair it with Grafana, Loki or another log platform, and Alertmanager or a paging tool.
When should a team choose Datadog instead of open-source tools?
Datadog is useful when the team wants a managed platform with metrics, logs, APM, synthetics, dashboards, and integrations in one place. Open-source tools may fit better when cost control, portability, and self-hosting are more important.
How do you reduce noisy monitoring alerts?
Start by deleting alerts with no owner or action path. Then page only on user-impacting symptoms, attach runbooks, group related alerts, and review noisy pages every week.
What is the difference between monitoring and observability?
Monitoring usually checks known signals such as metrics, logs, uptime, and alerts. Observability helps teams investigate unknown failure modes through richer telemetry, especially traces, structured logs, and high-quality context.

Leave a Reply